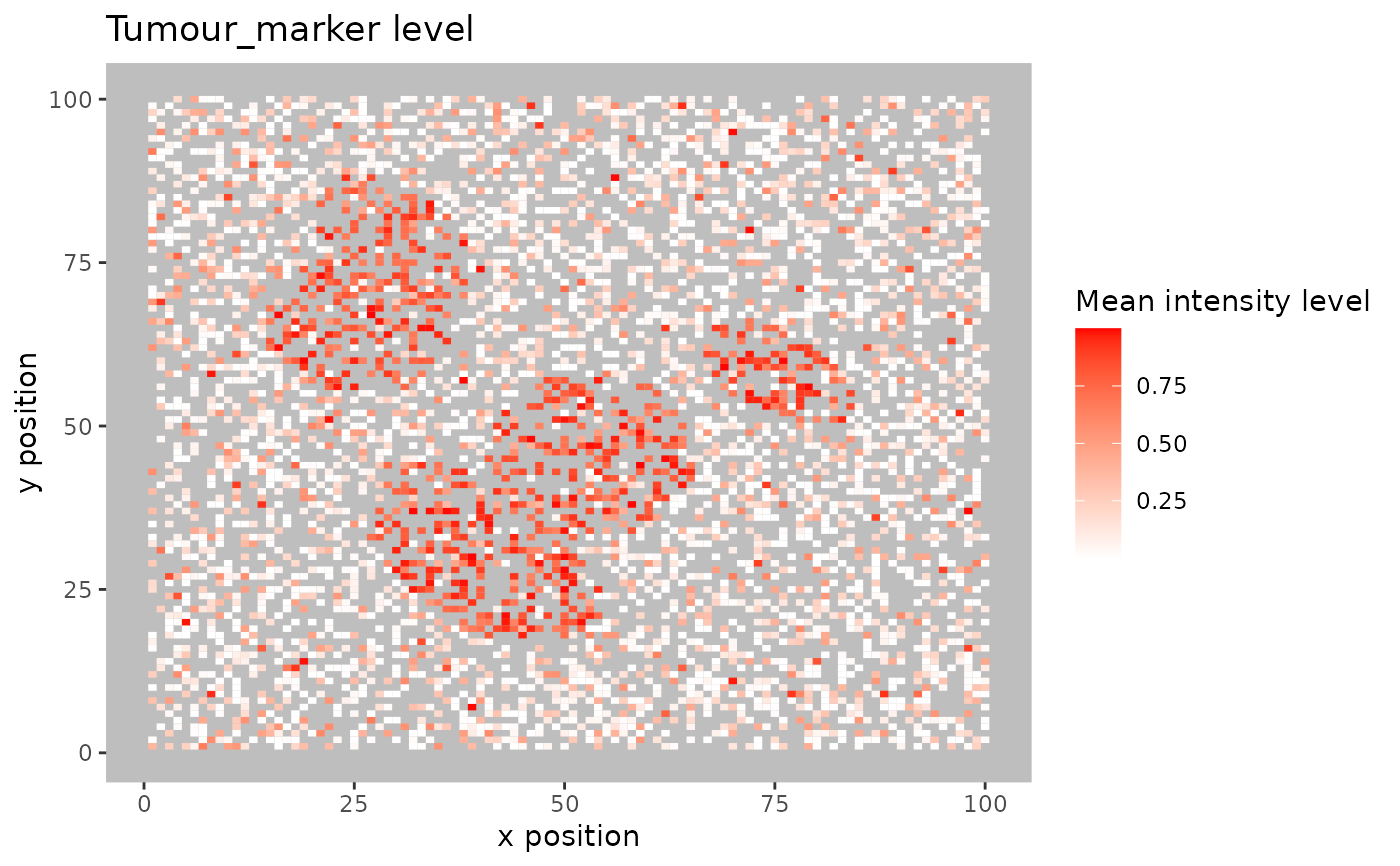
Blurs the image by splitting the images into small squares. The marker levels are then averaged within each square. All cells are considered, regardless of phenotype status.
Arguments
- sce_object
SingleCellExperiment object in the form of the output of
format_image_to_sce.- num_splits
Integer specifying the blurring level (number of splits) for the image. Higher numbers result in higher resolution.
- marker
String. Marker to plot.
Examples
plot_marker_level_heatmap(SPIAT::simulated_image, num_splits = 100, "Tumour_marker")