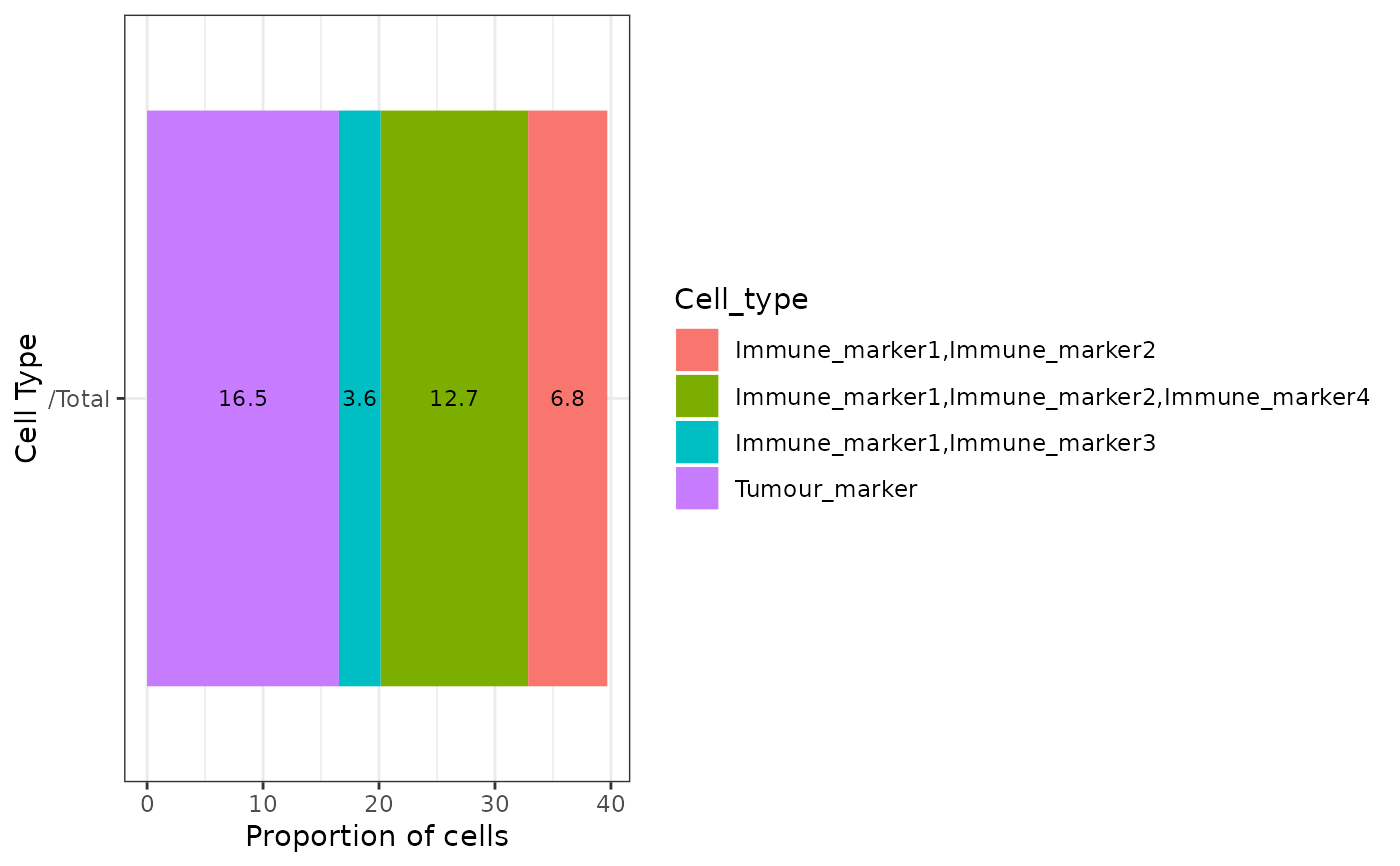
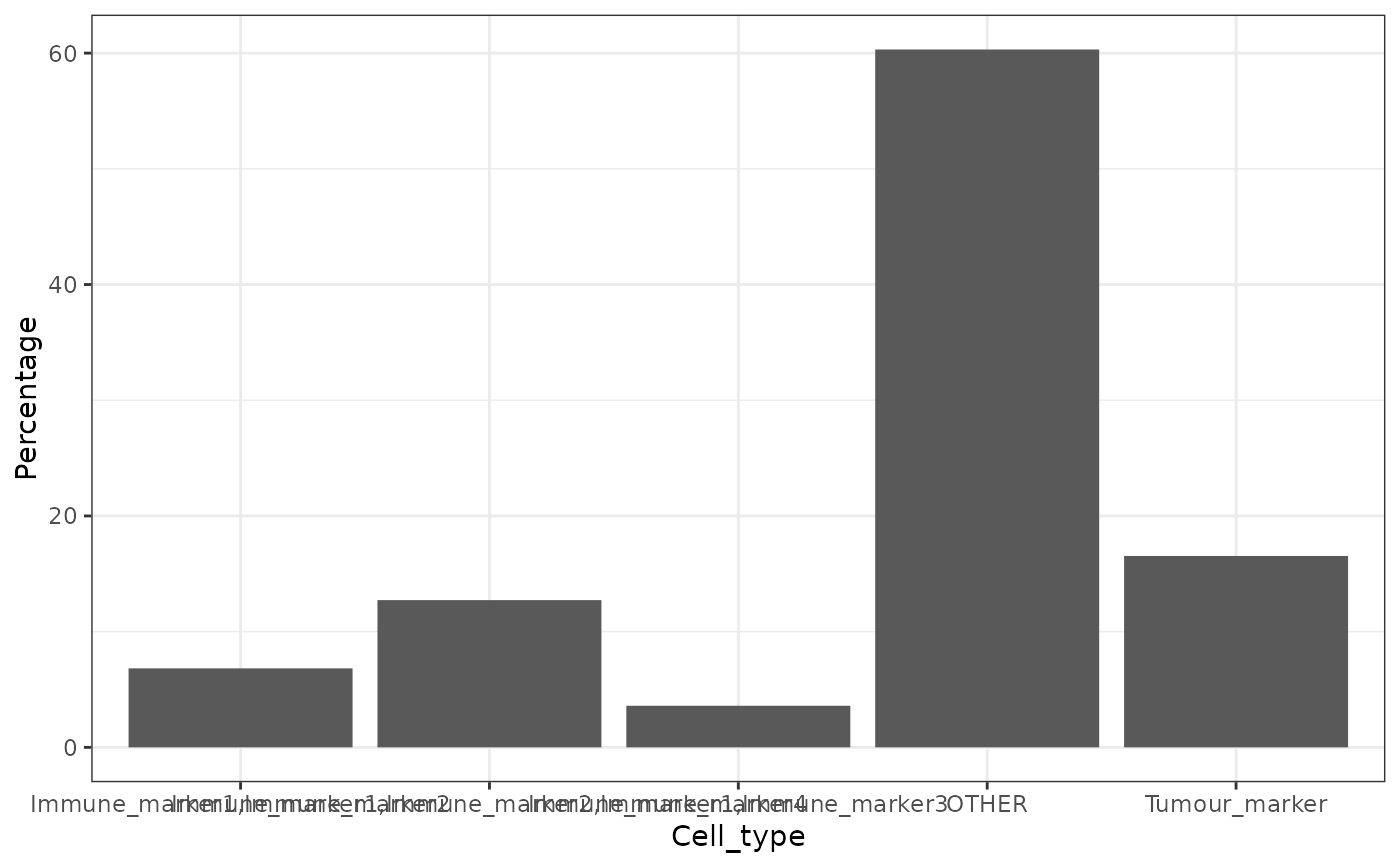
Plots cells proportions as barplots.
Usage
plot_cell_percentages(
  cell_proportions,
  cells_to_exclude = NULL,
  cellprop_colname = "Proportion_name"
)
Arguments
- cell_proportions
Data Frame. Output from
calculate_cell_proportions.- cells_to_exclude
String Vector. Markers to exclude.
- cellprop_colname
String. Column to use for y axis names. Default is "Proportion_name".
Examples
p_cells <- calculate_cell_proportions(SPIAT::simulated_image)

plot_cell_percentages(p_cells)