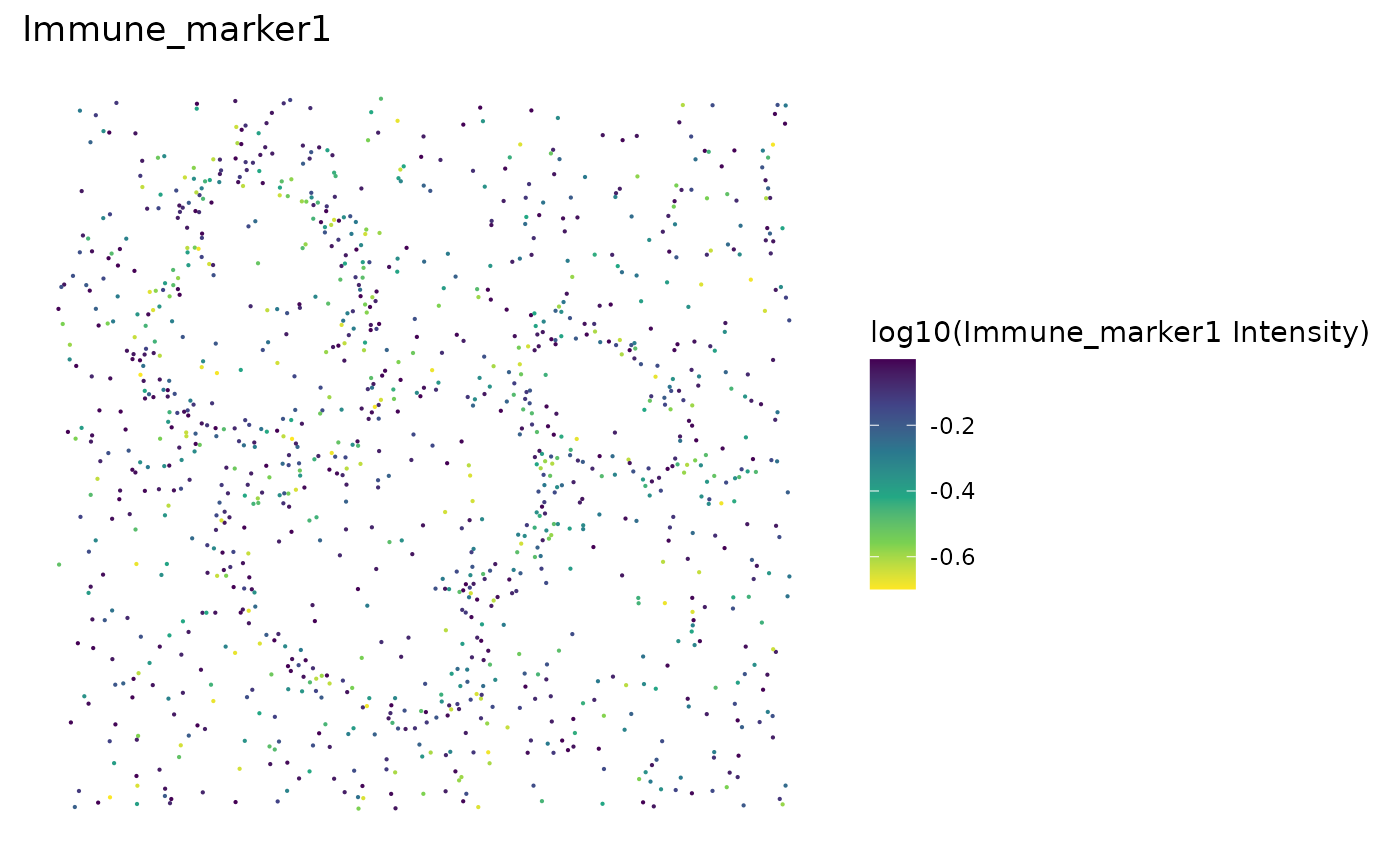
Produces a scatter plot of the level of a marker in each cell. The level of the marker in all cells is shown, at x-y positions, no matter if cells are phenotyped as being positive or negative for the particular marker.
Arguments
- sce_object
Singlecellexperiment object in the form of the output of
format_image_to_sce.- marker
String. Marker to plot.
Examples
plot_cell_marker_levels(SPIAT::simulated_image, "Immune_marker1")