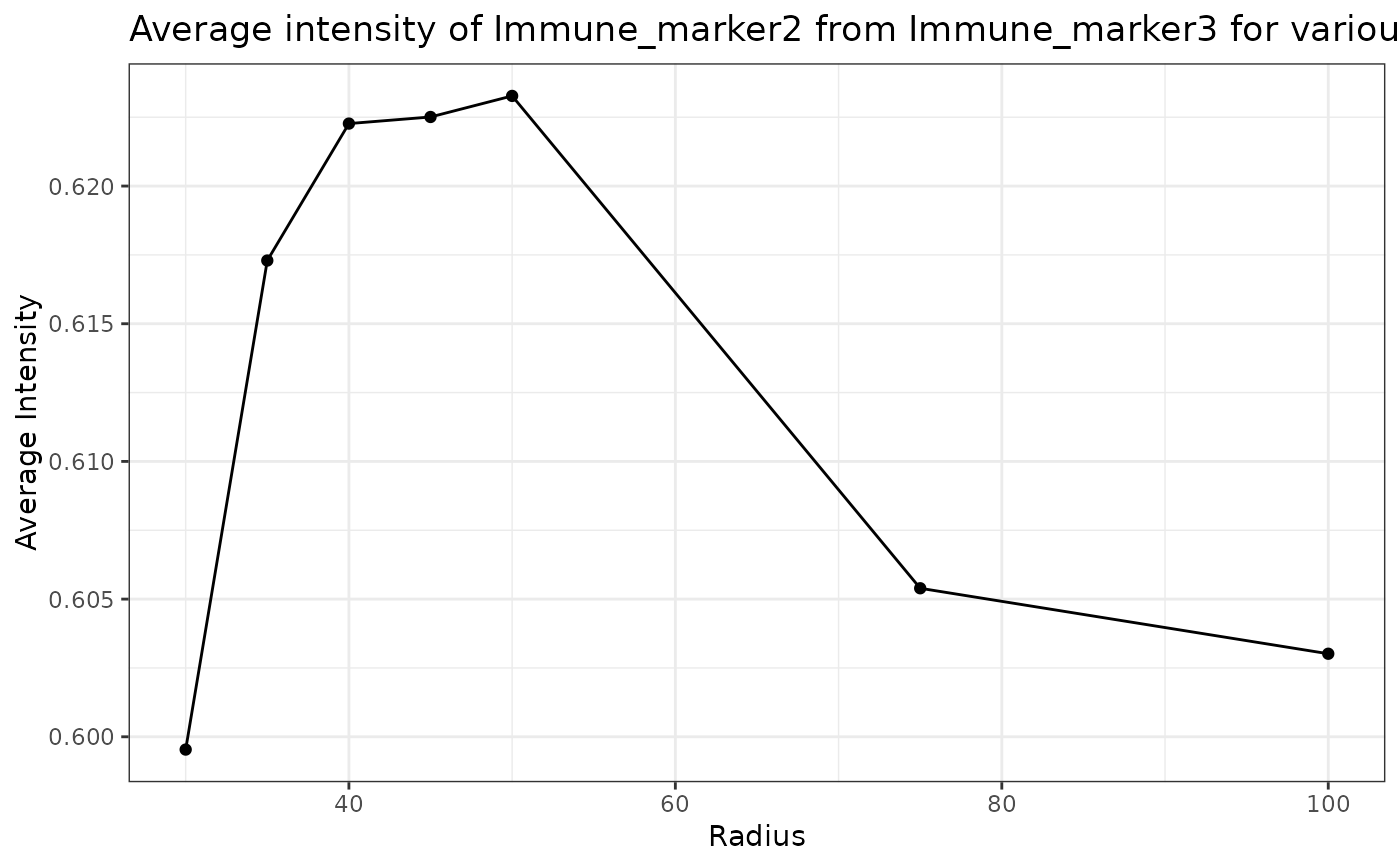
Takes in a vector or radii and calculates the average intensity of a target marker using average_intensity function. It plots the intensity level as a line graph.
Arguments
- sce_object
SingleCellExperiment object in the form of the output of
format_image_to_sce.- reference_marker
String specifying the reference marker.
- target_marker
String specifying the marker to calculate its average intensity.
- radii
Numeric Vector specifying the search radius around reference cells.
Examples
plot_average_intensity(SPIAT::simulated_image, reference_marker="Immune_marker3",
target_marker="Immune_marker2", c(30, 35, 40, 45, 50, 75, 100))