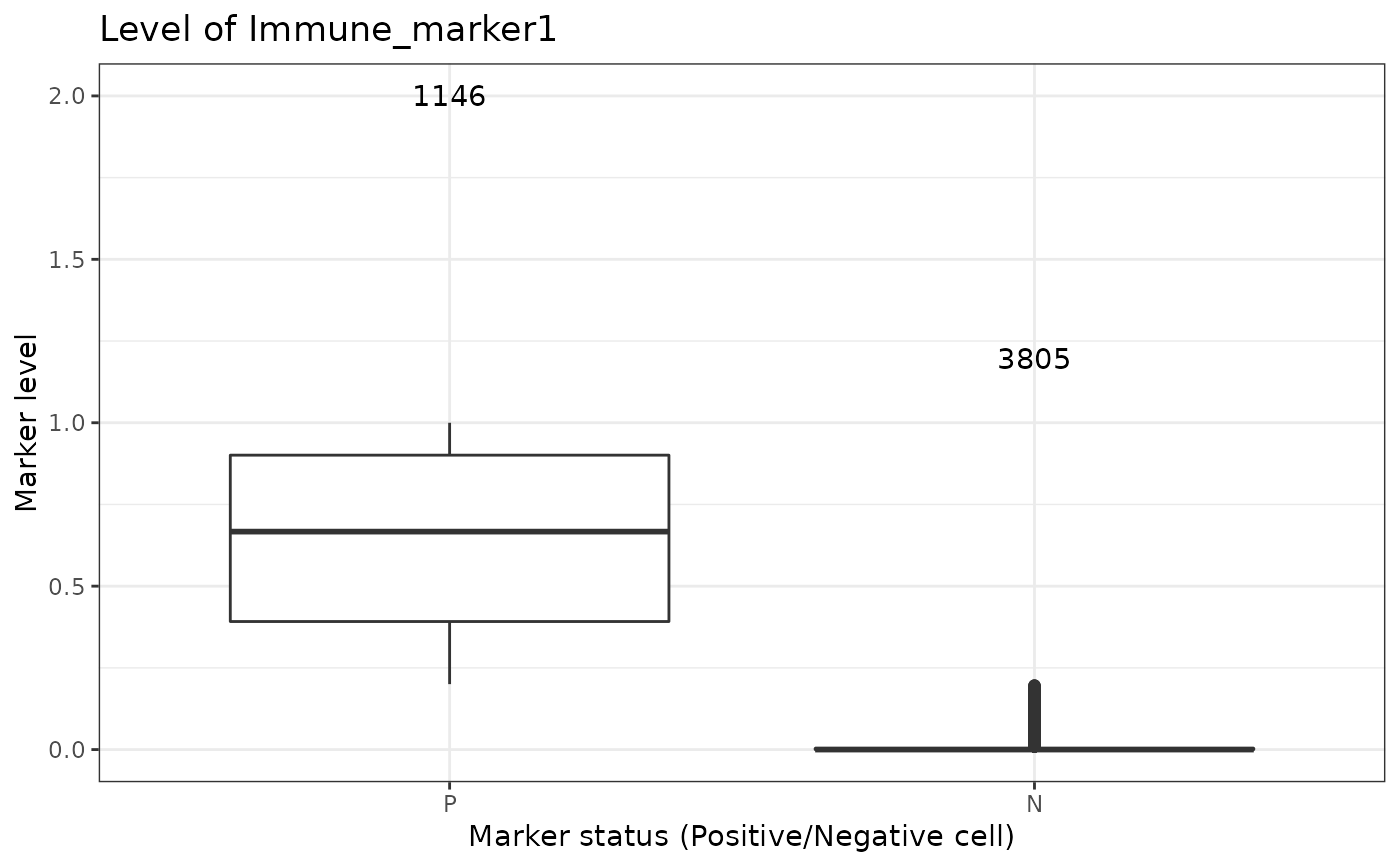
Produces boxplots of marker levels for cells phenotyped as being positive for the marker, and those that where phenotyped as being negative.
Arguments
- sce_object
SingleCellExperiment object in the form of the output of
format_image_to_sce.- marker
String. Marker being queried.
Examples
marker_intensity_boxplot(SPIAT::simulated_image, "Immune_marker1")