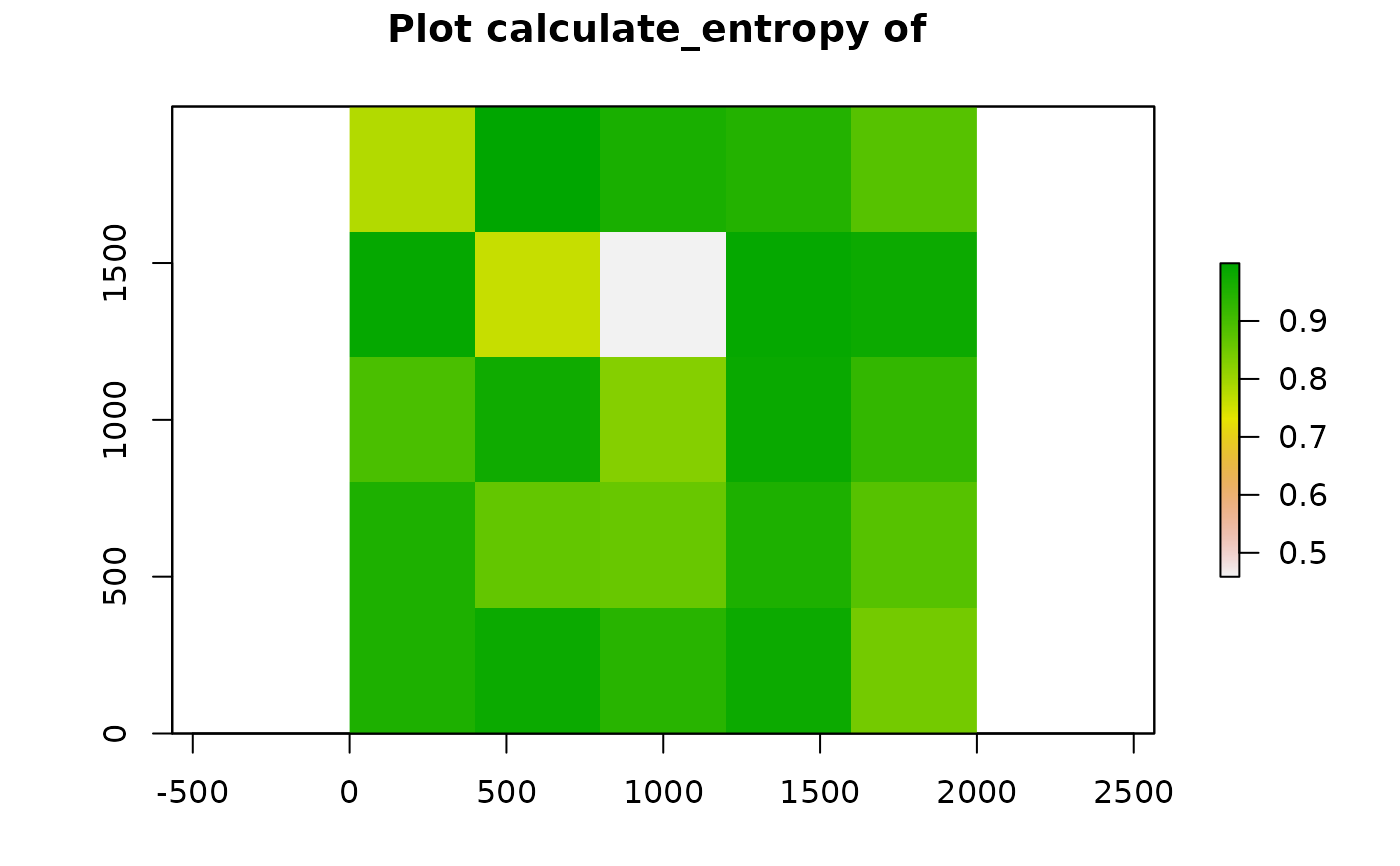
Calculates a specified metric for each grid tile in the image and plots the metrics for the grid tiles.
Arguments
- sce_object
SingleCellExperiment object in the form of the output of
format_image_to_sce.- FUN
Variable name specifying the metric to be calculated.
- n_split
Integer specifying the number of splits for the calculation of metrics. This number is the splits on each side (e.g. `n_split` = 3 means the image will be split into 9 tiles.)
- ...
Arguments of FUN
Examples
grid <- grid_metrics(SPIAT::defined_image, FUN = calculate_entropy, n_split = 5,
cell_types_of_interest=c("Tumour","Immune3"), feature_colname = "Cell.Type")