Dimensionality reduction plot
Source:R/dimensionality_reduction_plot.R
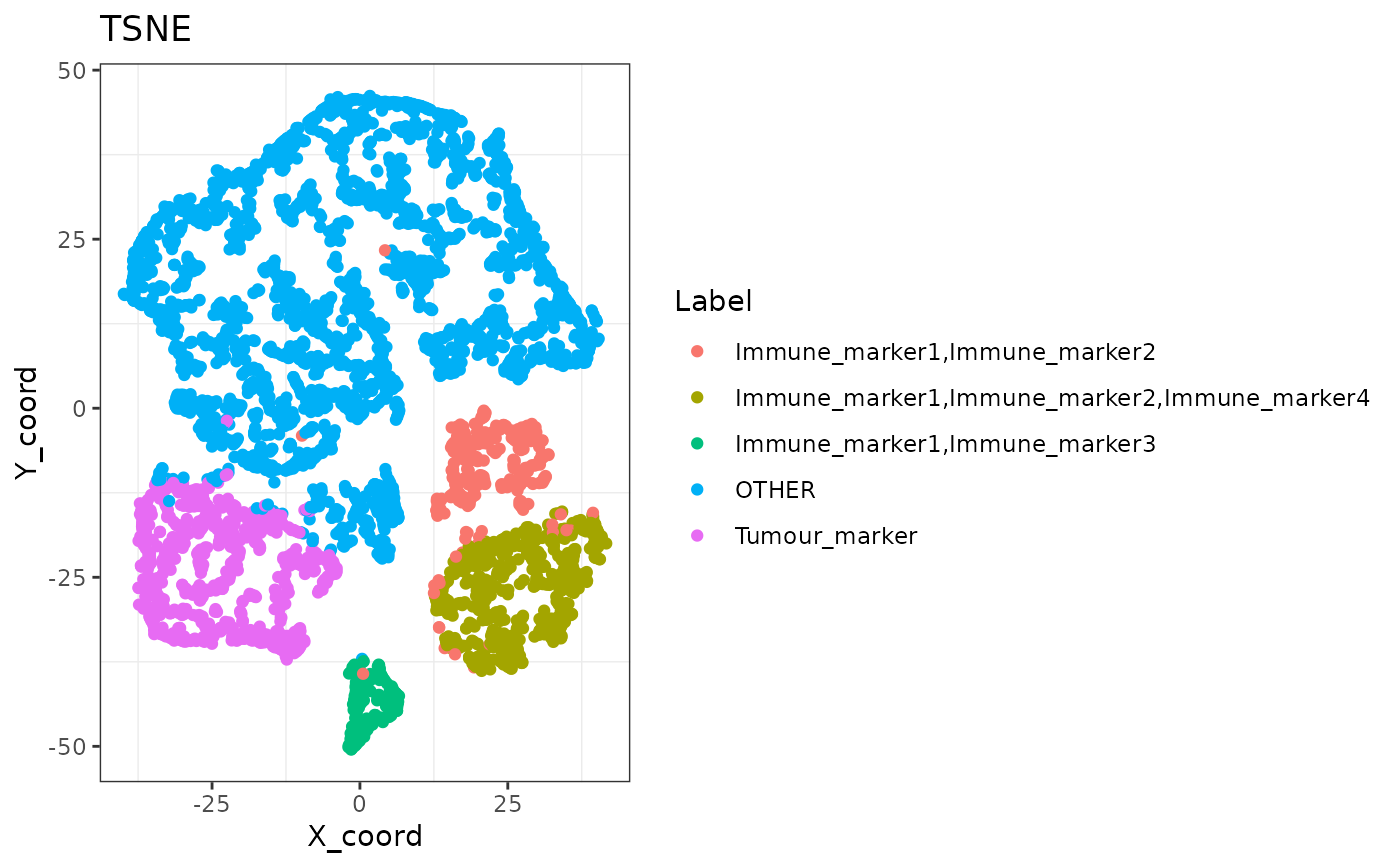
dimensionality_reduction_plot.RdGenerates the dimensionality reduction plots (UMAP or tSNE) based on marker intensities. Cells are grouped by the categories under the selected column. -- have you tried doing PCA on the matrix and then doing the UMAP/tSNE? Does it help? scRNAseq workflows do this. (?)
Usage
dimensionality_reduction_plot(
  sce_object,
  plot_type = "UMAP",
  scale = TRUE,
  feature_colname
)
Arguments
- sce_object
SingleCellExperiment object in the form of the output of
format_image_to_sce.- plot_type
String. Choose from "UMAP" and "TSNE".
- scale
Boolean. Whether scale the marker intensities.
- feature_colname
String. Specify the column name to group the cells.
Examples
dimensionality_reduction_plot(SPIAT::simulated_image, plot_type = "TSNE",
feature_colname = "Phenotype")